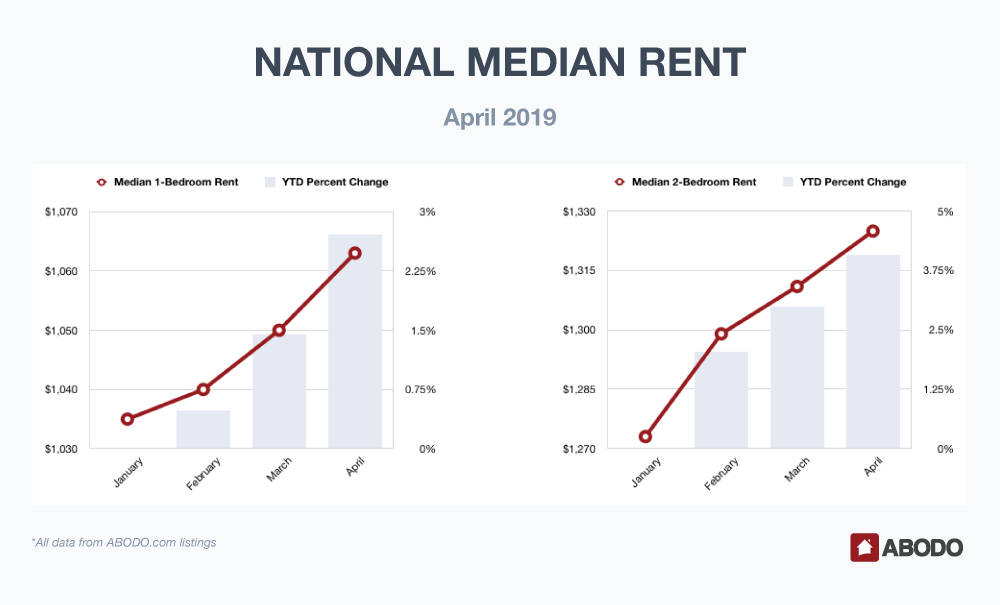
We predicted moderate rent increases for April, and that trend is still evident. It is interesting to note, however, that these rising apartment rental rates are still at the top of our guidance ranges.

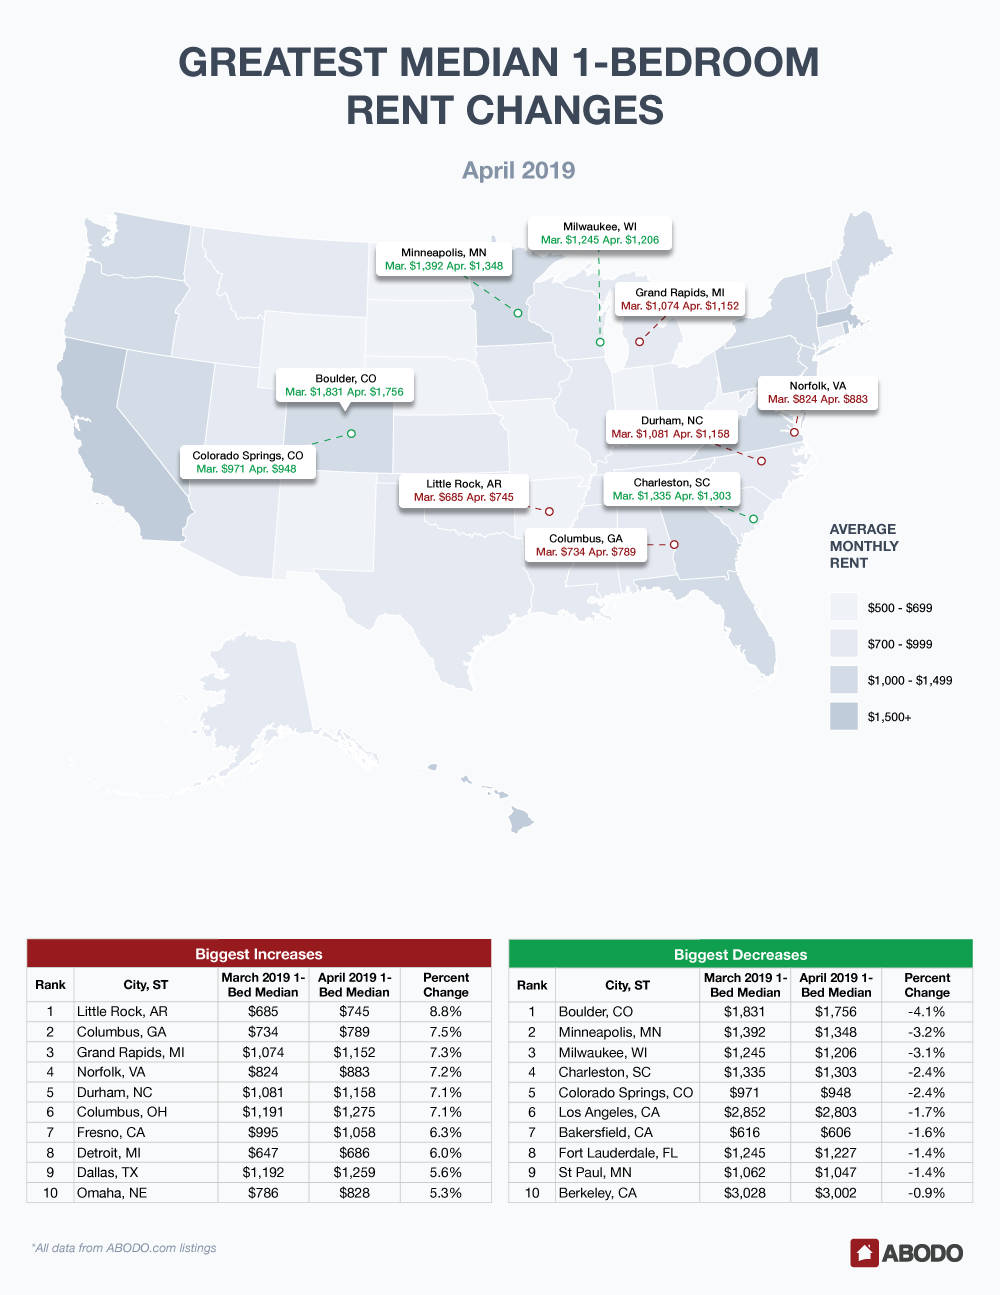
Cities with top ten rent one-bedroom increases charged ahead at almost double the percentage moves of the top ten municipalities with declining one-bedroom rents. Let’s get into it and see how things look.
1-Bedroom Apartments
One-bedroom units reported a move from a median $1,050 in March to $1,063 in April. For the year, one-bedroom apartments have already surged 2.71 percent.
Gainers
Holding onto the number one spot was Little Rock, AK, moving a torrid 8.8 percent to $745 from March’s $685. This definitely takes Little Rock off of our cheap places to live in the U.S. list. The second through sixth spots were tightly bunched as Grand rapids, MI, Durham, NC, Norfolk, VA and Columbus, OH all showed increases in the 7.1 to 7.5 percent range.
Fresno, CA and Motor City Detroit, MI showed respective increases of 6.3 and 6.0 percent and Dallas, TX and Omaha, NE finished off our top ten gainer list with rent increases from 5.3 to 5.6 percent.

Losers
While Boulder, CO led the losers list, its decrease was a very moderate 4.1 percent as its April median one-bedroom rent fell to $1,831 to a still pricey $1,756. Minneapolis, MN seems to have shrugged off the recent rugged winter with only a 3.2 percent loss and recent gainer Milwaukee, WI fell 3.1 percent back to reality.
Charleston, SC and Colorado Springs both lost 2.4 percent, and the cities in sixth through ninth place in the loser’s bracket — Los Angeles, CA, Bakersfield, CA, Fort Lauderdale, Fl and St. Paul, MN — only lost 1.4 to 1.7 percent. Berkeley, CA fell an insignificant 0.9 percent, but still managed to remain amazingly expensive at $3,002.
State (& D.C.) Winner
Washington, D.C. surpassed Massachusetts with the highest state average rent price climbing just a dollar to $2,468. Allowing D.C. to take the number one spot was Massachusetts, as that state posted a large $193 April one-bedroom average decline.
2-Bedroom Apartments
Like last month, two-bedroom units have almost doubled the gain of their one-bedroom cousins as they moved from $1,311 to $1,325 in April, boasting a healthy 4.08 yearly percentage gain.
Gainers
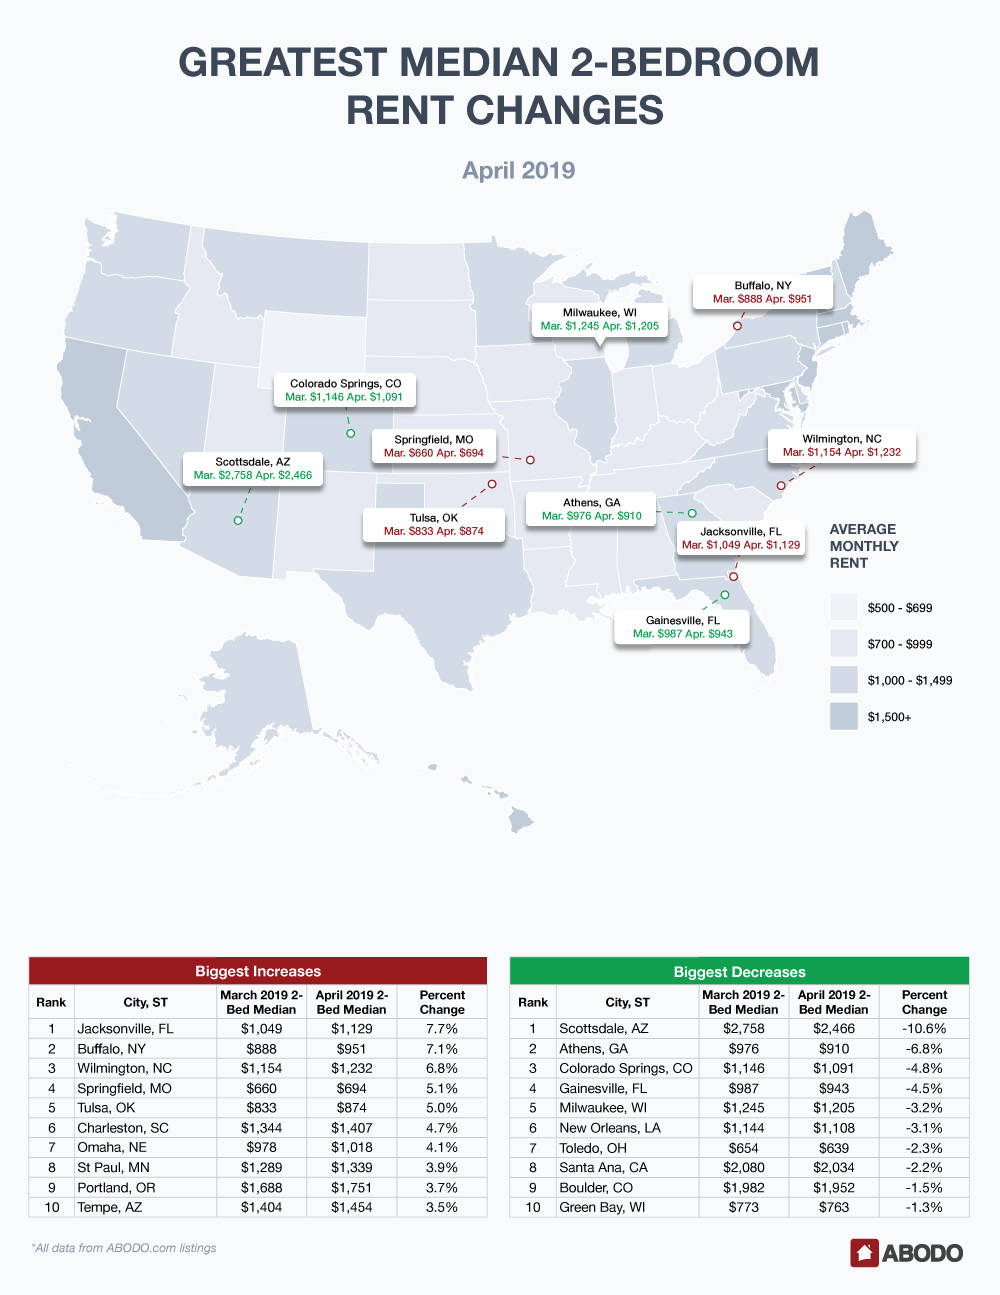
Jacksonville, FL, at $1,129 moved 7.7 percent to claim the number on spot. Buffalo, NY was not far behind, as that snow capital increased 7.1 percent but stayed under $1,000 at $951.
Wilmington, DE was squarely alone in third place as it posted a 6.8 percent rise. Springfield, MO and Tulsa, OK both rose about 5.1 percent, and Charleston, SC and Omaha, NE gained 4.7 and 4.1 percent respectively. St. Paul, MN, Portland, OR and Tempe, AZ claimed the last three gainer spots with increases in the upper 3 percent range.

Losers
Scottsdale, AZ was the biggest loser with a staggering 10.6 percent drop to $2,466 from $2,758 in March. Athens, GA fell 6.8 percent, and Colorado Springs, CO and Gainesville, FL decreased in the mid-four percent range.
Milwaukee, WI claimed loser spot number five with a 3.2 percent loss with The Big Easy, New Orleans, LA showing a similar 3.1 percent drop. Both Toledo, OH and Santa Ana, CA fell about 2.3 percent, and Boulder, CO and used-to-be Title Town U.S.A., Green Bay, WI, lost 1.5 and 1.3 percent respectively.
Recap & What’s Next?
The stock market had a mini-scare as an important T-bond yield curve inverted, but oil prices reached $60 per barrel, and world geo-political tensions seemed to stay flat. With the Mueller Report looking like a non-event along with a reasonable Fed that doesn’t seem inclined to raise rates, we’re looking at stable economic conditions that should keep the upward rent trend viable.
As usual, stay tuned since rapid economic changes can translate into a quickly altered national rent picture.
For press inquiries, please contact Sam Radbil.
Methodology
Each month, using over 1 million Rentable listings across the United States, we calculate the median 1-bedroom and 2-bedroom rent prices by city, state, and nation, and track the month-over-month percent change. To avoid small sample sizes, we restrict the analysis for our reports to cities meeting minimum population and property count thresholds.
