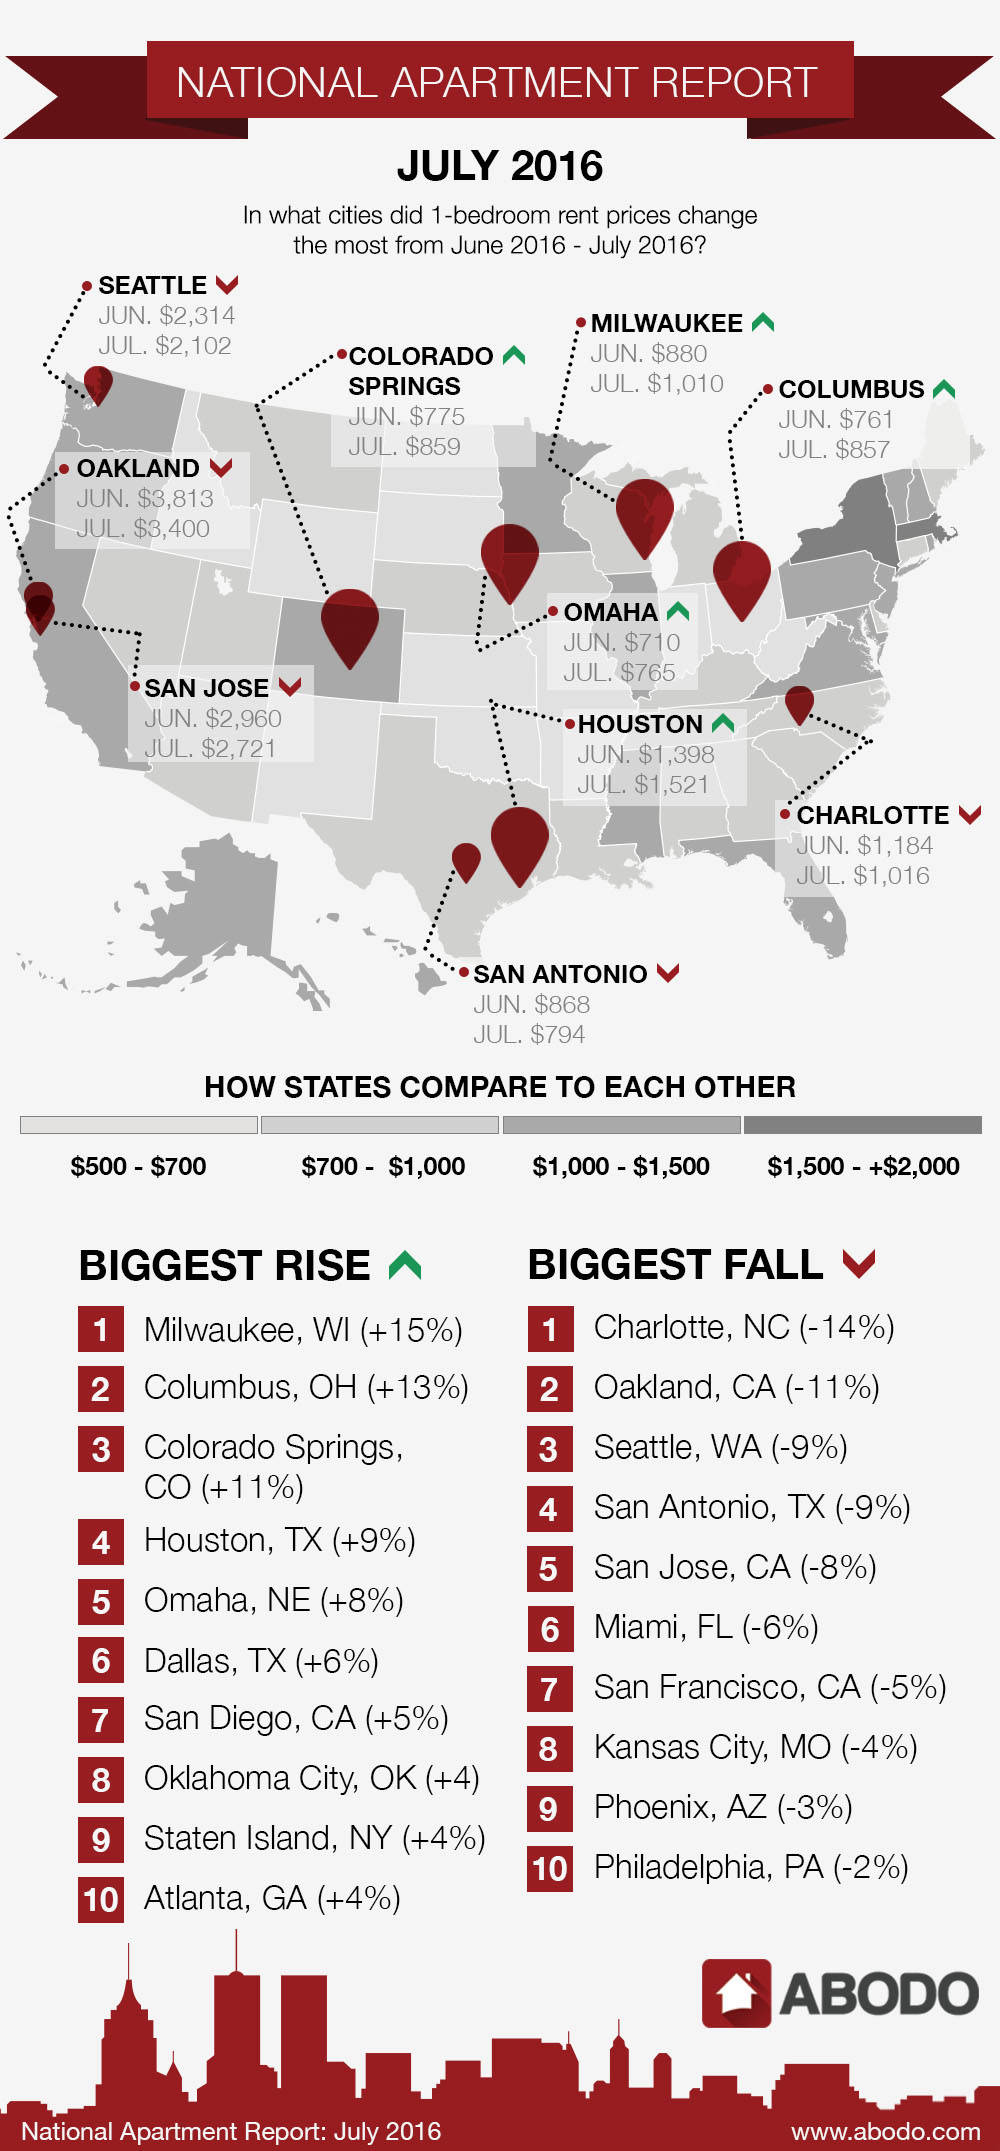
Graphic: Where is rent increasing and decreasing the most?

Facing High Demand, Vacancy Rates Plunge
As demand for rental properties continues to climb, vacancy rates have plummeted to the lowest level since 1985. According to the U.S. Census Bureau, only 7% of rental housing units nationwide were available in the first quarter of 2016, with the West and Northeast regions being hardest hit by tight housing markets.
Although construction of multifamily rentals saw a five-year boom from 2010 to 2015, the rapid development of new rental households continues to drive demand up and vacancies down.
Given their size and location, it’s no surprise that states such as New Hampshire and Rhode Island have some of the lowest overall rental vacancies in the U.S., at just 2.9% and 2.6%, respectively, according to the U.S. Census Bureau.
California — which Rentable ranked as one of the most expensive states to live in this month — has a persistently low vacancy rate as well, at 4.1% for Q1. (However, Oakland rent fell 11% in June, while San Diego rose only 5%.)
Milwaukee, which saw its vacancies drop from 5.6% in Q4 to 4.1% in Q1, had the largest rent hike in the nation for June, at 15%, according to Rentable.
Columbus, OH, closed out last year with a 7.4% vacancy, but this year that sunk to 6.6% — accordingly, rental prices have also been on the rise. For the past two months, Columbus has ranked in Rentable’s top 10 rent-raisers. In June, rent soared 13%.
Although vacancies are trending downward nationwide, some areas are seeing more empty units than usual. Charlotte, NC, for example, nearly doubled its vacancy rating since late last year, from 5.7% to 10.6%. For June, Charlotte also saw the largest decrease in rent price, according to Rentable, down 14%.
And North Dakota, a state notorious for its low population, has one of the country’s highest vacancy ratings at 14.6%. Naturally, it also enjoys some of the lowest rent.
Fueling the nationwide trend of falling vacancy rates, about 36% of U.S. households — or 110 million people — lived in rentals last year, according to a recent report from the Joint Center for Housing Studies at Harvard University. Since 2005, renter households grew by 9 million — the largest 10-year gain in history, according to the JCHS — while home ownership continues to wane.
Do the new households mean Millennials are finally leaving the nest and their roommates behind? Not quite.
The bulk of new renters — about 4.3 million — over the past 10 years were in their 50s and 60s, with ages 70-plus also seeing a jump. Next up, 3 million 30- to 40-year-olds joined the renting world. Millennials — the largest generation in history — only accounted for about 1 million.
The largest segment of renters, regardless of age, have a household income under $25,000. Unfortunately, rental availability rates for low-income housing remain exceptionally low. A study by the National Low Income Housing Coalition found only 57 units available and affordable for every 100 very low-income renters, and even fewer for extremely low-income renters.
Going forward, rental household growth is expected to continue to rise as Millennials age and strike out on their own. The future for vacancies, however, is a little less clear. Many construction efforts are proceeding cautiously or are on pause, Bloomberg reports, as once-steeply-climbing rents are beginning to level. If Millennials, as anticipated, create more than 2 million new households each year until 2025, the renting market with remain robust.
