NOTE: This report is outdated. Please find our 2020 Annual Rent Report here.
2016 was an odd year: Prince, David Bowie, and Muhammed Ali died; Great Britain exited the European Union; the United States elected Donald Trump president — and Oakland, CA’s, rent decreased an average of 4% every month.
Buoyed by a steadily improving economy and the lowest unemployment rate in nine years, Americans have more and more control over their living arrangements. And increasingly, they are choosing to rent. Meeting the demand for rental properties is a dynamic, volatile process. As renters continue to move in from the suburbs into city centers, new developments can have drastic effects on a city’s rental market month to month.
To make sense of it all, we took a look back at a year’s worth of Rentable data. How did rent prices change nationally? At the state level? Where did rent increase the most over 2016, and where did it decline? Where are the 10 most expensive rental markets? Read on to find out.
A YEAR IN RENT
The national average rent price fluctuated quite a bit throughout the year, according to Rentable data. Overall, however, the year held more monthly increases than decreases, with an average monthly change — the mean of every month-over-month change throughout the year — of .67%, for a total increase of $85 between January and December. Nationwide, the average renter in 2016 paid $1,001 per month.
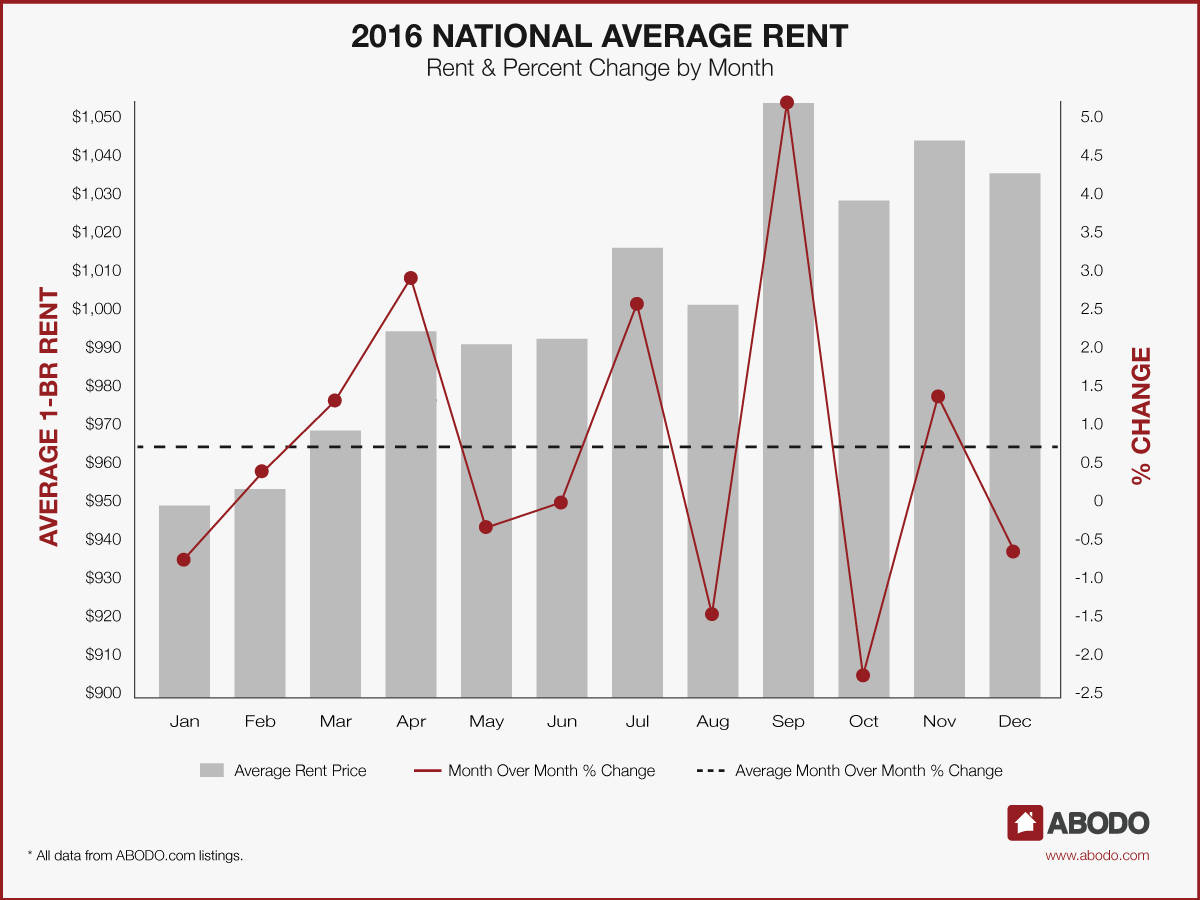
The year’s lowest average monthly rent started 2016 off, with $949 for a one-bedroom apartment in January, which was down .83% from December 2015. Steady monthly increases — except for May and August, which saw decreases of .38% and 1.48%, respectively — led to the year’s peak in September, with a high national average rent of $1,052, up 5.13% from August. Following a sharp decrease in October rent, the average rent price slid back down to $1,034 by December.
The upward trend is visible in Rentable’s state-by-state data as well, with all but six states reporting an increase in average rent in 2016.
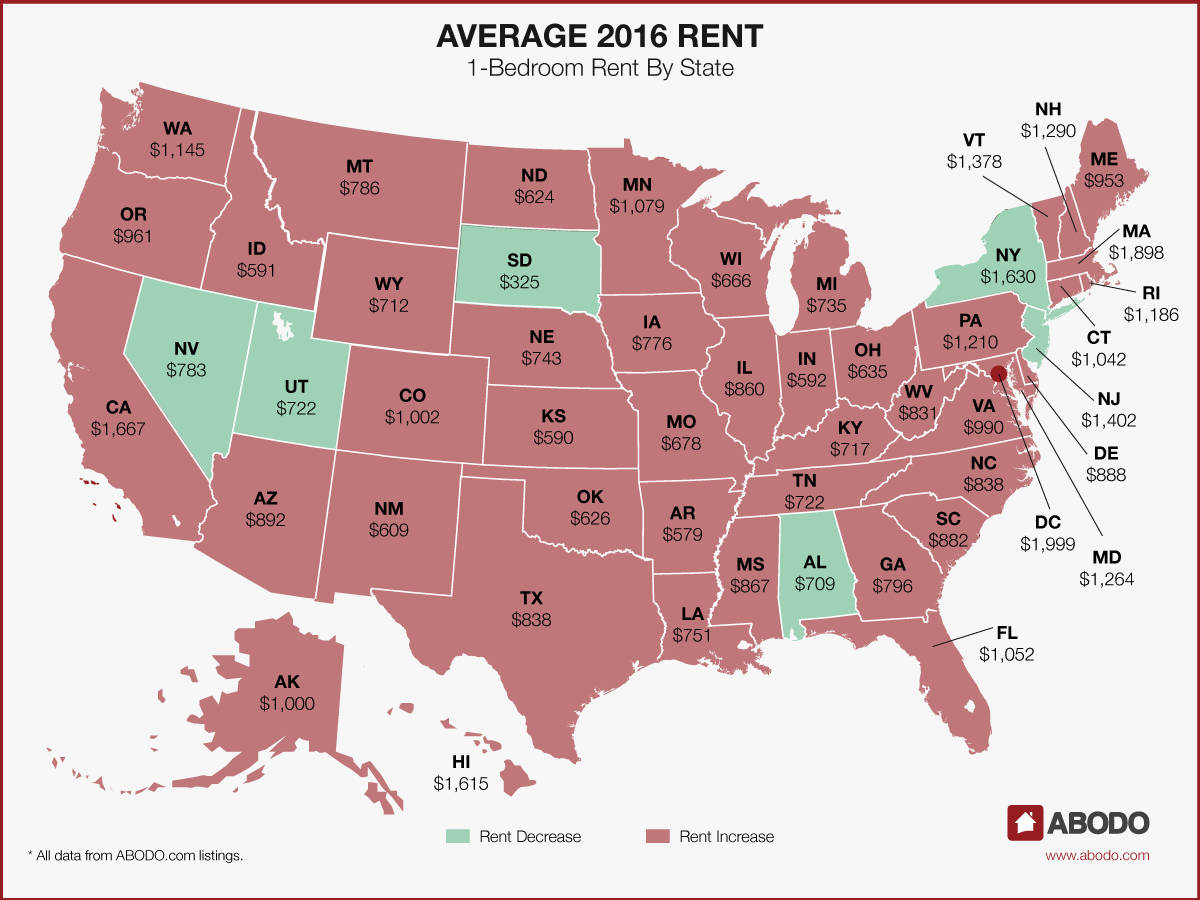
New Jersey snagged the largest average monthly decrease of 1.3%, down to $1,402. Nevada saw a similar decrease of 1.1%, to $783, while New York and Utah saw decreases of less than 1%. Data for South Dakota showed no increase or decrease, holding steady at $325, the nation’s lowest rent, for a one-bedroom apartment.
On the other hand, rent increases render our map nearly entirely red. The largest hike of the year goes to Rhode Island, up a monthly average of 7.1%, pushing the average one-bedroom price up to $1,186. In second place, Connecticut saw an average monthly increase of 6.9%, with one-bedrooms costing $1,042 per month. Minnesota came in with the third-largest average monthly change of 5.6%. An average one-bedroom in that state was $1,079 in 2016.
Arizona, Washington D.C., Idaho, Georgia, Indiana, Kentucky, Mississippi, Michigan, Oregon, and South Carolina all also saw sizable increases of around 2% or more, while other states, including Oklahoma, Nebraska, Colorado, and, surprisingly, California, barely felt a thing.
In terms of dollars — not change — Washington D.C. led the nation with the highest average rent of $1,999. Close behind, Massachusetts renters paid $1,898 for a one-bedroom apartment, those in California paid $1,667, and New York $1,630. Although South Dakota is enjoying the lowest one-bedroom rents in the nation ($325), those with leases in Arkansas are also paying a low $579 — a little more than half of the national average of $1,001. Just behind Arkansas, Idaho sits at $591 and Indiana at $592.
2016 CHANGE BY CITY
Examining average monthly changes in city rents yields a diverse group. The city with the highest average percent change in 2016 was Columbus, GA, at over 5%. That’s twice Georgia’s state average monthly change of 2.5%. Philadelphia, with an average monthly increase of 4.2%, follows closely behind, but the majority of the cities with the greatest average hikes are in the South, Southwest, and Midwest. When it comes to increasing rent, several cities in those regions far outpace their state. Raleigh, NC (3.8%); Winston-Salem, NC (3.1%); Scottsdale, AZ (3.7%); and El Paso, TX (2.7%) more than triple their state average rates of rent increase.
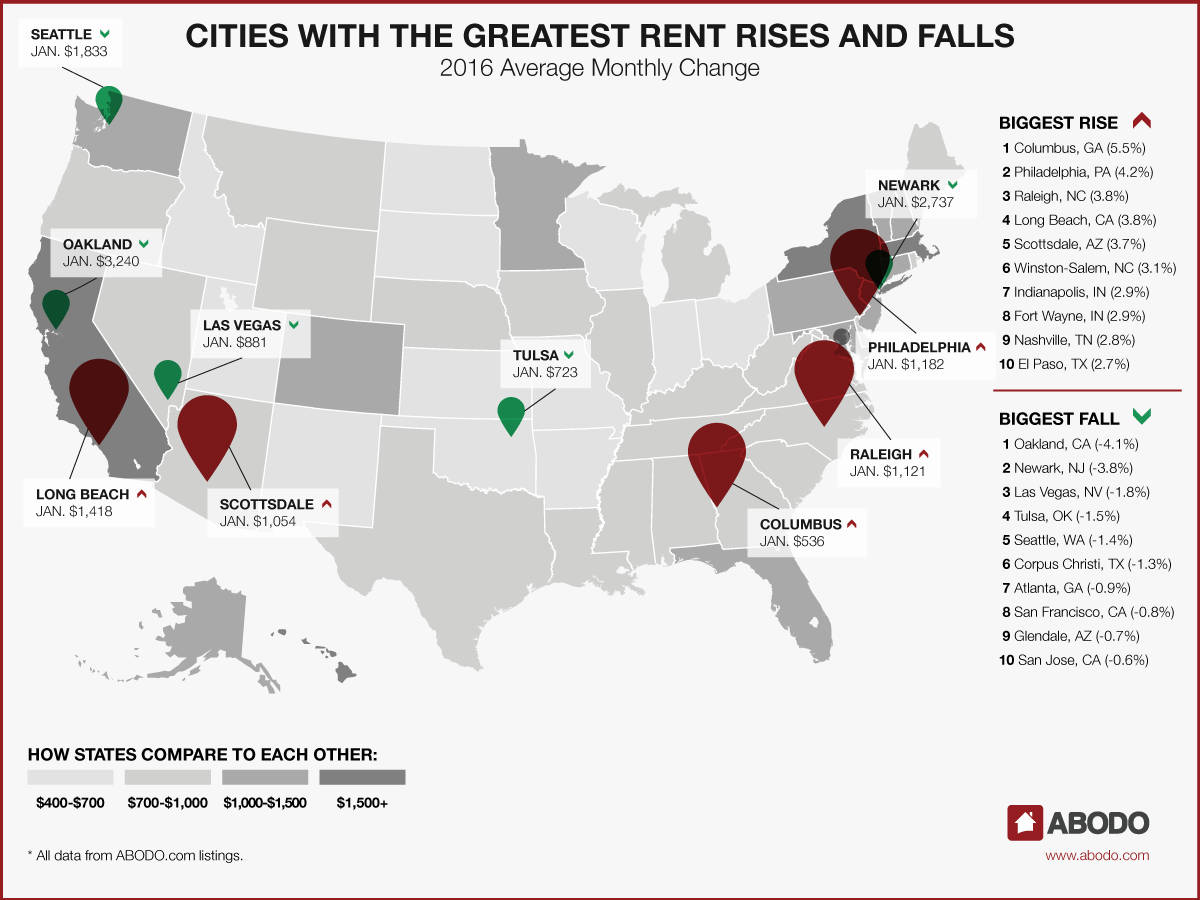
The 10 cities with the biggest average monthly drops in 2016 rent also veered west. Aside from Newark, NJ (-3.8%), none of the cities on the list are on the East Coast. Surprisingly, the Bay Area is well-represented, with rents in list-leading Oakland (a shade over a 4% average decrease), San Francisco (-.8%) and San Jose (-.6%) all trending down.
RENTS IN JANUARY 2017
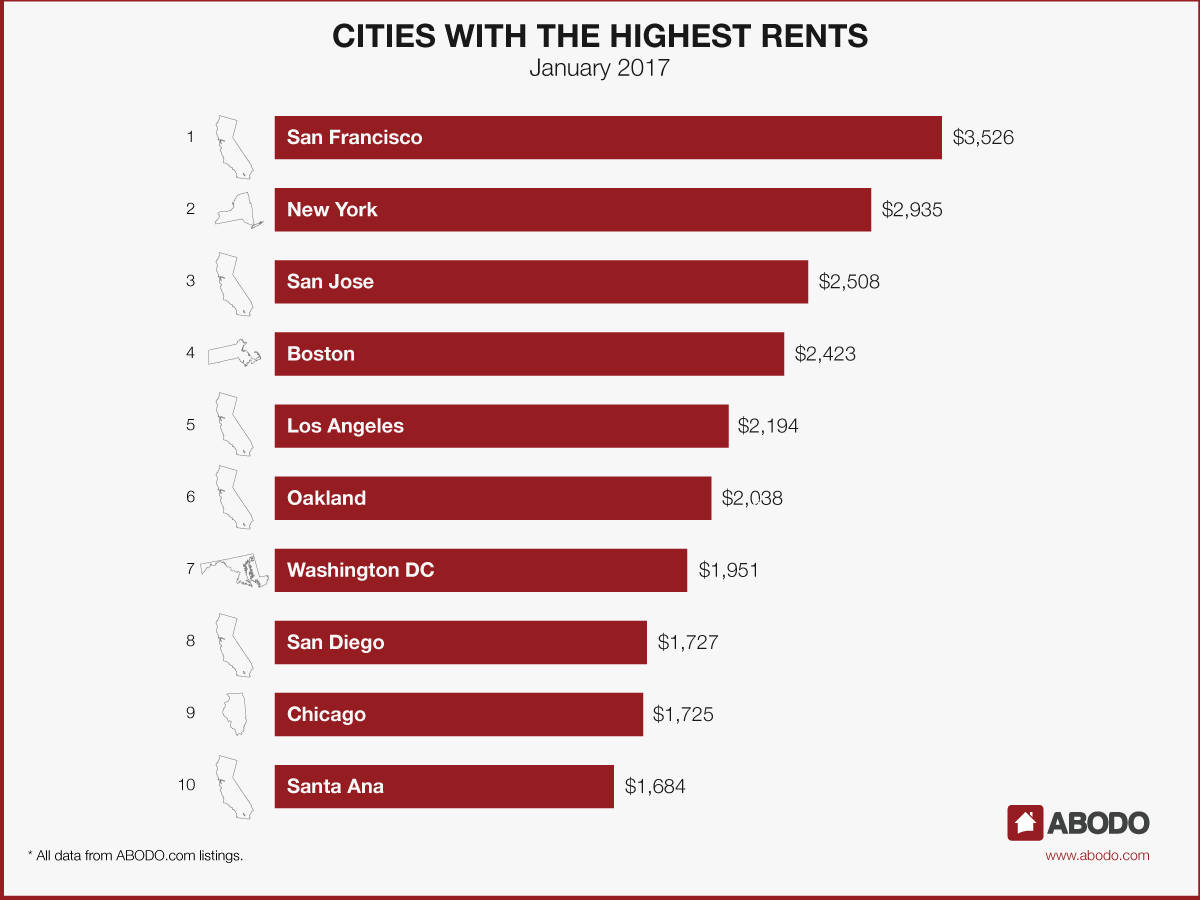
So how are rents looking for the new year? San Francisco is leading the pack starting off 2017, with the highest January rent in the country by a wide margin: an average of $3,526 for a one-bedroom. New York City falls in second place, at $2,935, with San Jose and Boston close behind, at $2,508 and $2,423, respectively. There are no huge surprises further down the list, either, with Los Angeles, Oakland, Washington, D.C., San Diego, and Chicago all making an appearance.
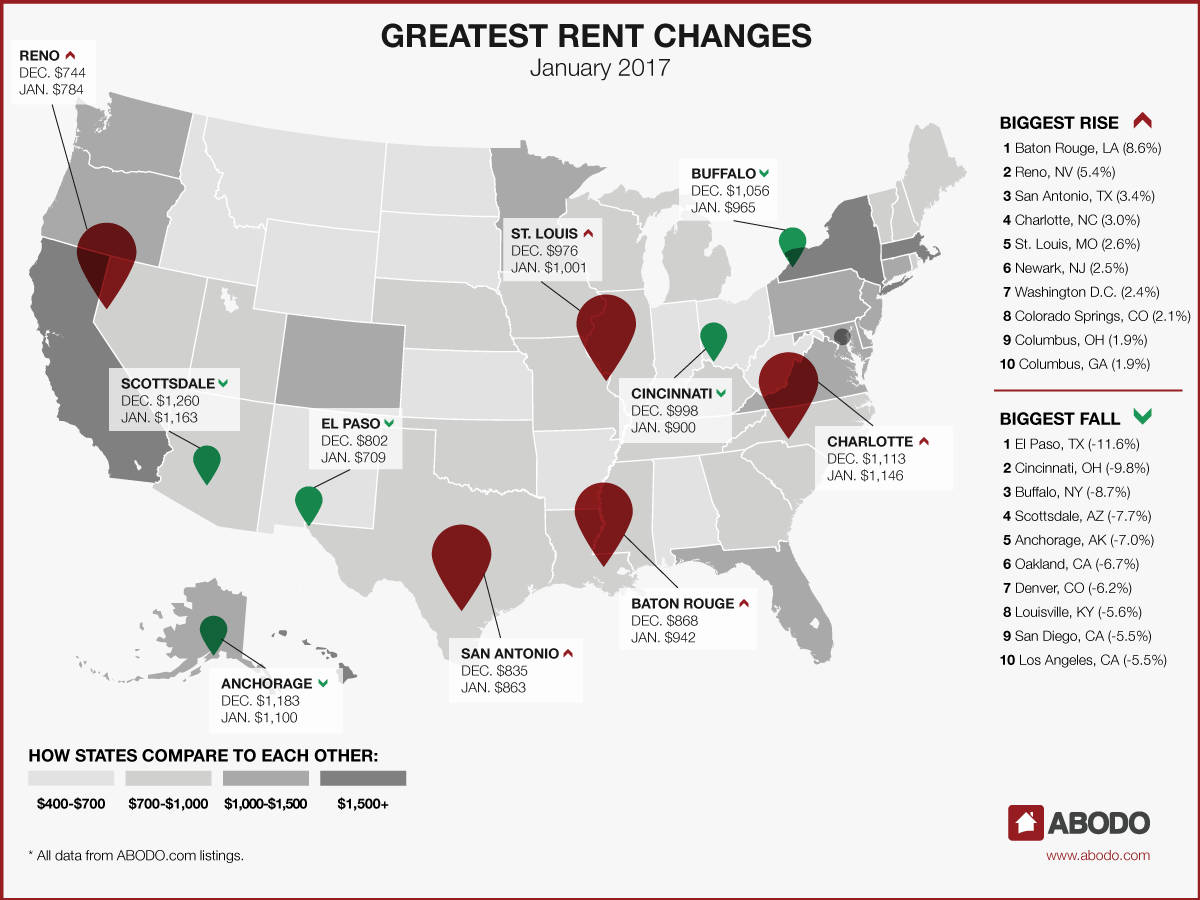
The biggest rent change in the country for January was felt in El Paso, TX, which also saw one of the nation’s highest average monthly increases for all of 2016. This time, however, El Paso is seeing rents slide a bit, with average one-bedroom rent down 11.6% to $709. Cincinnati, OH, saw the second-largest drop of 9.8%, down to $900. Buffalo, NY (-8.7%); Scottsdale, AZ (-7.7%); Anchorage, AK (-7%); Oakland, CA (-6.7%); and Denver, CO (-6.2%), all also saw sizable decreases.
Baton Rouge, LA, wasn’t quite as lucky, with the average one-bedroom rent price surging 8.6% in January, up to $942. Reno, NV, rent is up 5.4%, while far behind, San Antonio, TX, is up 3.4%, Charlotte, NC, 3%, and St. Louis, MO, 2.6%. At the bottom of the list, each Columbus (OH and GA) is up 1.9%.
Overall, the large decreases in El Paso, Cincinnati, Buffalo, and other cities offset the rent rises, for a decrease in the national average one-bedroom rent price of 1.35%.
CONCLUSION
No one can predict the future. But if 2016 was any indication, rents in 2017 will continue to rise. The continuing revitalization of aging urban cores — especially in the South and the Midwest — has made renting an attractive option for both young professionals and boomers looking to move back into the city. Low interest rates didn’t necessarily push renters into ownership, and with the mid-December announcement that the Fed will raise interest rates for only the second time since the 2008 market crash, it’s unlikely that the trend will change, at least in the short term.
As urban centers continue to receive an influx of new residents, and rental rates climb nationally, how effectively will the supply of housing meet high demand? Can new construction keep pace? The answers to these — and many other — questions depend on the health of the economy under future President Trump. Only time will tell if his policies continue the economy’s upward trend of the last eight years.
METHODOLOGY
Each month, using over 1 million Rentable listings across the United States, we calculate the average 1-bedroom rent price by city, state, and nation and track the month-over-month percent change. For this report, we analyzed this data for the entire year of 2016 and found the average of the monthly percent changes in list price separately for each state and city. We also calculated the 2016 average list price in each state by taking the average of all monthly average list prices.
To avoid small sample sizes, we restricted our city-level analysis to cities meeting minimum population and property count thresholds.
For press inquiries, contact Sam Radbil.
